ENC compilation
selection for ENC compilation
To obtain data for ENC first defining required area (by coordinates or interactively from map), scale and contour intervals are necessary.
HIS then automatcally
- finds survey areas inside the defined area
- analyses overlaps,
- extracts depths, objects and contours,
- performs sounding generalization into the desired scale,
- creates necessary meta-objects from survey areas
- and saves all data into required format (DAF by default).
DXF and ESRI Shape formats are available but they do not represent S-57 objects, and also do not include meta- objects.
Depths and contour output depends on the desired scale or output resolution. Starting from a scale of 1:5000 or depth resolution of 4m, the data are taken from cells instead of depth tables of survey areas. This significantly decreases depth extraction time as data in cells are already prepared into the desired scale. It also makes possible depth extraction from very large areas, for example from all Estonia (total area of larger water bodies is around 36,000 km 2 ).
Overlaps.
In order to query depths or objects from overlapped survey areas some automatic procedures have to be performed. First topological analysis of area borders gives exact areas where overlapping occurs, second procedure analysis relevant survey areas and finds which ones have better quality and/or newer data. These data will have precedence over others, so querying depths from HIS gives from overlapping survey areas only newest and better quality data.
Cells
For seamless depth and contours database HIS is using cells. Depths are stored in cells in 11 different resolution from 4 to 500 m. Contours are created and stored in 1m interval. Viewing and querying the depth data means getting data from relevant cells in resolution needed. That makes possible to see data in web mapping services quickly. Same is true about depth contours. The cells are filled automatically from survey areas when new validated data are available.
Definitions :
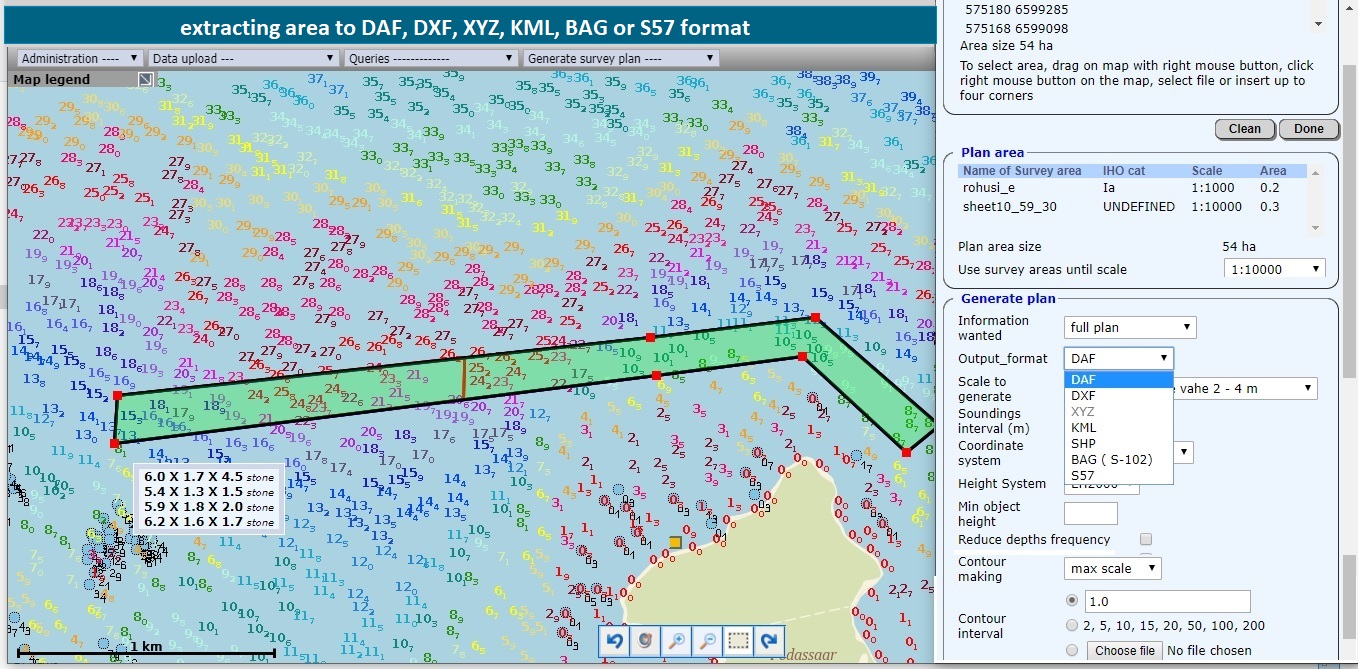
- 1) Defining area of interest (the same way as spatial query)
- 2) Defining required information type : only depths, only objects or full data (depths,objects,contours)
- 3) Defining wanted output format : available formats are S-57, DAF (Dkart ASCII format), DXF, Shape, XYZ, KML. Output format depends on previous selection – for example only depths are allowed only into XYZ format.
- 4) Defining output scale or depth resolution (if only depths selected) from predefined list.
- 5) Defining contour interval : 3 possible ways – one interval, predefined 'cartographic' intervals or intervals from text file.
- 6) Defining output coordinate system : currently EPSG:3301 and EPSG:4326 (WGS84 lat/long). Other possibilities are available.
Processing :
-
1) After definitions the process first analyses defined area – if the area is less than 50 km2 then the depth
data will be taken from depth tables for each survey area and contours will be created based on these depths.
Generalization of depths will be done according to defined scale/depth resolution. If bigger than 50 km2 then
depths and contours are taken from cells. As depths in cells are already stored in different resolutions then
no further generalization is needed – depths are selected in defined resolution. If area is bigger than 8000
km2 then only allowed information type is only depths.
Such approach makes data access very quick – compiling basic map in S-57 format in scale 1:100000 from 6000
km2 area from hundreds different survey areas takes just some minutes.
The area sizes are definable in configuration file.
2) First case also triggers analyses of overlaps: depths are taken from overlapping survey areas taking into account survey time and quality (IHO_S44 class). Second case does not need such analysis as the cells are already filled in this way. S-57 and DAF formats will need analysis of overlapping survey areas anyway as the required meta-objects (like MQUAL) need this. c. Next process selects depths from tables or cells according to defined area and generalizes them into output scale if needed.
3) Then contours will be generated or selected if it was wanted.
4) Selection of underwater objects if wanted.
5) Finally all these data will be written into selected output data format and download link will be sent to user.
The whole process is logged, temporary files and log files are stored in special folder. This folder is cleaned once a week. Brief log about user activities is also kept in database (tables 'stat user', 'stat user info', 'stat user plan')